

Australia’s housing market officially set a new record in September 2025, with CoreLogic’s national Home Value Index rising past its previous peak. However, behind this impressive headline figure lies a more complex story: the monthly pace of growth has noticeably slowed, signaling a new phase for the market.
Although home values have now risen for the eighth consecutive month, the growth is losing steam as affordability issues and a seasonal rise in spring listings begin to take effect.
A complete analysis of the Australian property market for October 2025. National home values have reached a new record, but the pace of growth is slowing. Discover the performance gap between cities and the market outlook for the final months of the year.
Australia’s Property Market Overview: A New Record High Amid Slowing Momentum
Australia’s housing market officially set a new record in September 2025, with CoreLogic’s national Home Value Index rising past its previous peak. However, behind this impressive headline figure lies a more complex story: the monthly pace of growth has noticeably slowed, signaling a new phase for the market.
Although home values have now risen for the eighth consecutive month, the growth is losing steam as affordability issues and a seasonal rise in spring listings begin to take effect.
National Headline Figures (September 2025)
- Monthly Growth: National home values increased by +0.6%.
- Quarterly Growth: The growth for the third quarter was +2.2%.
- Median Value: The national median home value now stands at approximately $792,028.
- Full Recovery: The market has officially recovered from the 2022-2023 downturn and is now at its highest level ever recorded.
Table 1: Home Value Change Since Peak
| Geography | From Peak | Peak Date | Past 5 Years | Since Feb (1st rate cut) |
|---|---|---|---|---|
| Sydney | <at peak> | <at peak> | 37.9% | 4.2% |
| Melbourne | -2.7% | Mar 22 | 17.5% | 2.9% |
| Brisbane | <at peak> | <at peak> | 80.1% | 6.6% |
| Adelaide | <at peak> | <at peak> | 77.2% | 3.7% |
| Perth | <at peak> | <at peak> | 82.7% | 6.7% |
| Hobart | -9.5% | Mar 22 | 29.5% | 1.2% |
| Darwin | <at peak> | <at peak> | 39.3% | 12.0% |
| Canberra | -3.98% | May 22 | 29.8% | 3.1% |
| Regional NSW | <at peak> | <at peak> | 49.7% | 2.7% |
| Regional Vic | -4.6% | May 22 | 34.8% | 2.7% |
| Regional Qld | <at peak> | <at peak> | 76.9% | 6.0% |
| Regional SA | <at peak> | <at peak> | 78.4% | 5.5% |
| Regional WA | <at peak> | <at peak> | 87.1% | 6.4% |
| Regional Tas | -0.5% | May 22 | 47.4% | 0.9% |
| Regional NT | -7.3% | Apr 16 | 6.1% | 2.3% |
| Combined capitals | <at peak> | <at peak> | 43.2% | 4.5% |
| Combined regionals | <at peak> | <at peak> | 59.3% | 4.2% |
| National | <at peak> | <at peak> | 46.8% | 4.4% |
CoreLogic Home Value Index, Released on 1st October 2025
A “Multi-Speed” Market: Brisbane, Adelaide, and Perth Lead the Pack
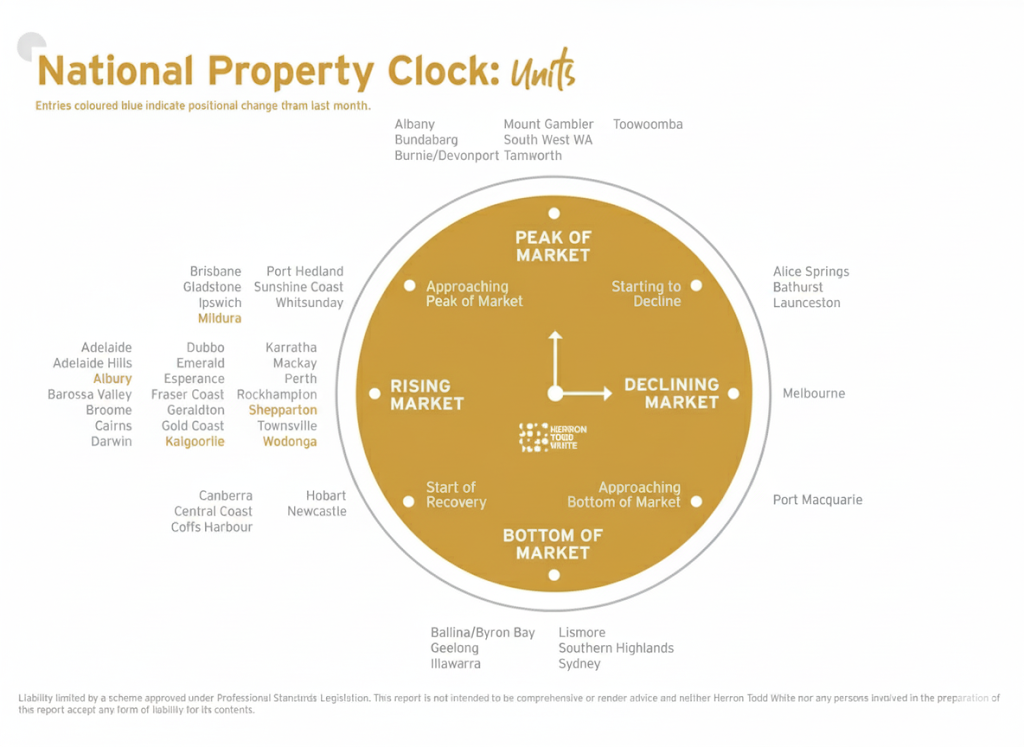
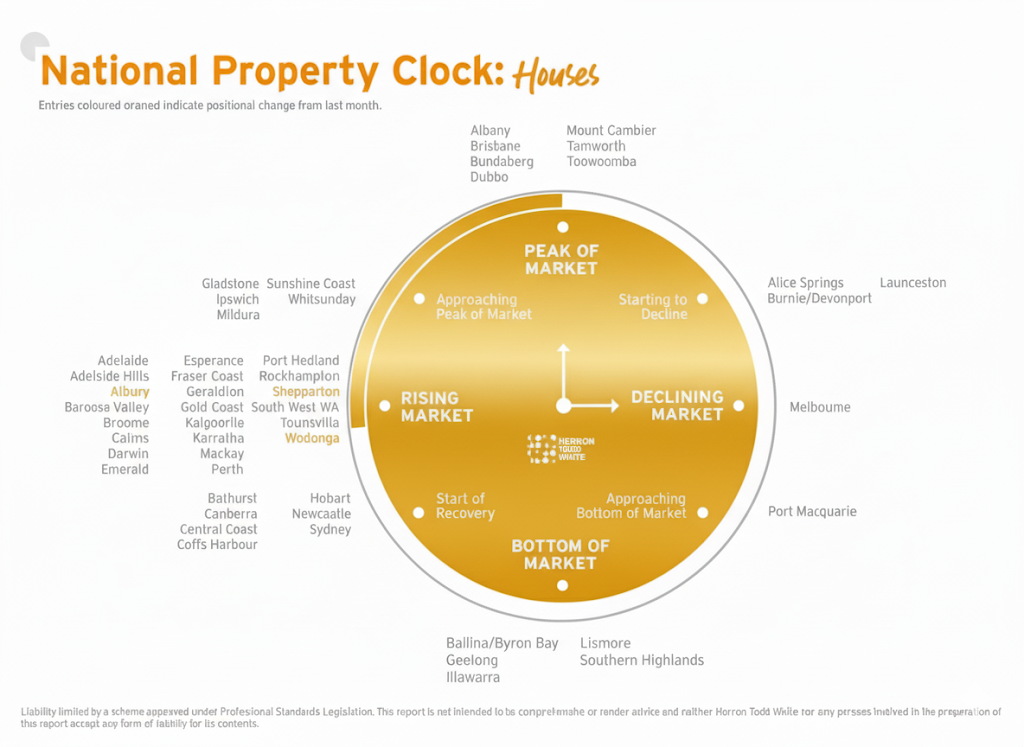
The market slowdown is not uniform across the country. Instead, a “multi-speed” scenario is becoming increasingly evident, driven largely by differences in affordability and supply conditions.
- The Hottest Markets: Brisbane (+1.5%), Adelaide (+1.4%), and Perth (+1.3%) continue to be the strongest performing markets, maintaining solid growth thanks to relatively better affordability and low advertised stock levels.
- Sydney and Melbourne Decelerate: The two largest cities recorded much more modest growth, with Sydney up +0.4% and Melbourne up just +0.2%. Affordability pressures and a significant increase in homes listed for sale this spring have cooled conditions in these markets.
- Hobart Remains the Exception: Hobart was the only capital city to record a decline in the third quarter (-0.2%), showing that a market correction is still underway.
Table 2: Median Price & Growth Forecast
| City | Median Price* (Houses) |
Median Price* (Units) |
Total Price** (%) Growth (Houses) |
Total Price** (%) Growth (Units) |
|---|---|---|---|---|
| Sydney | $1.93M | $1.09M | 18% | 22% |
| Melbourne | $1.28M | $0.78M | 21% | 20% |
| Brisbane | $1.21M | $0.71M | 19% | 23% |
| Adelaide | $0.95M | $0.69M | 16% | 18% |
| Perth | $1.05M | $0.64M | 30% | 30% |
| Canberra | $1.17M | $0.75M | 19% | 20% |
| Hobart | $0.86M | $0.71M | 13% | 16% |
| Darwin | $0.70M | $0.46M | 24% | 26% |
| Combined Capitals | $1.34M | $0.87M | 20% | 21% |
* By June 2027 ** Over 3 years; Source: Oxford Economics, Pricefinder
The Rental Market: Still Under Pressure
The rental market across the nation remains incredibly tight, continuing to place significant pressure on tenants.
- Rising Rents: National rents increased by 1.6% over the third quarter.
- Extremely Low Vacancy Rate: The national vacancy rate is hovering at just 1.1%, indicating a severe shortage of rental supply. This creates favorable conditions for investors but a major challenge for renters.
Market Outlook: Interest Rates, Supply, and Consumer Confidence
Looking ahead, experts believe the market in the coming months will be shaped by these key factors:
- Interest Rates: While the Reserve Bank of Australia (RBA) has kept the cash rate on hold, expectations of a potential rate cut in 2026 are helping to support buyer confidence.
- Spring Supply: The number of homes listed for sale has increased substantially, particularly in Sydney and Melbourne. This gives buyers more choice and may help to ease the upward pressure on prices.
- Affordability: This remains the single biggest hurdle. Stretched affordability will likely continue to act as a brake on the pace of growth, especially in the most expensive markets.
Conclusion
Australia’s property market is entering a more balanced phase. While prices have reached a new peak, the rate of growth is moderating to a more sustainable level. The significant performance gap between the capital cities highlights the importance of looking beyond the national headline figures. For both buyers and sellers, understanding local market dynamics is the most critical factor in making a well-informed decision in the current environment.


